 如何在pytorch中使用tensorboard
# 安装与启动
安装:pip install tensorboard
启动:tensorboard --logdir==runs
注意:需要在运行程序的根目录运行,不然可能无效果
# 具体说明
类定义:
torch.utils.tensorboard.writer.SummaryWriter(log_dir=None, comment='', purge_step=None, max_queue=10, flush_secs=120, filename_suffix='')
1
构造函数:
__init__(log_dir=None, comment='', purge_step=None, max_queue=10, flush_secs=120, filename_suffix='')
1
参数:
- log_dir(str):保存文件的位置。默认值为
runs/CURRENT_DATETIME_HOSTNAME,每次运行后都会更改 - comment(str):附加到默认log_dir值的注释,如果设置了log_dir,则该参数不生效
- purge_step(int):与程序奔溃有关的参数
- max_queue(int):待处理事件的队列大小
- flush_secs(int):刷新时间
- filename_suffix(str):文件名
示例:
from torch.utils.tensorboard import SummaryWriter

# create a summary writer with automatically generated folder name.
writer = SummaryWriter()
# folder location: runs/May04_22-14-54_s-MacBook-Pro.local/

# create a summary writer using the specified folder name.
writer = SummaryWriter("my_experiment")
# folder location: my_experiment

# create a summary writer with comment appended.
writer = SummaryWriter(comment="LR_0.1_BATCH_16")
# folder location: runs/May04_22-14-54_s-MacBook-Pro.localLR_0.1_BATCH_16/
1
2
3
4
5
6
7
8
9
10
11
12
13
2
3
4
5
6
7
8
9
10
11
12
13
add_scalar:
add_scalar(tag, scalar_value, global_step=None, walltime=None, new_style=False, double_precision=False)
1
添加想要展示的数据到tensorboard中
参数:
- tag(str):数据简易描述
- scalar_value(float or string/blobname):保存的值
- global_step(int):要记录的全局步长值(可以看做是横坐标)
- walltime(float):可选的以秒记录事件时间的参数
- new_style(boolean):是否使用新格式展示内容(新格式:tensor field,旧格式:simply_value field),新格式拥有更好的加载速度
示例
 from torch.utils.tensorboard import SummaryWriter
writer = SummaryWriter()
x = range(100)
for i in x:
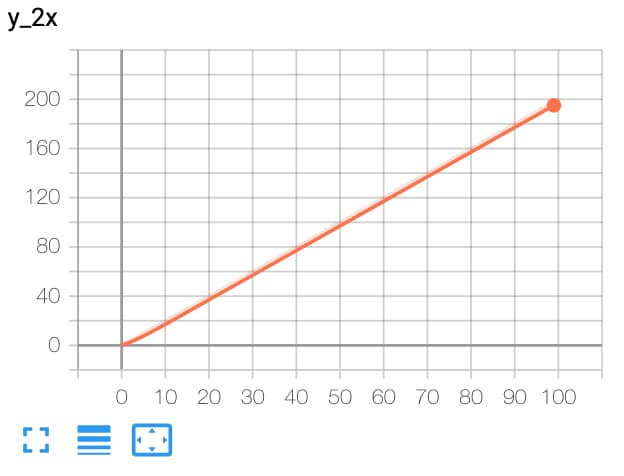
    writer.add_scalar('y=2x', i * 2, i)
writer.close()
1
2
3
4
5
6
2
3
4
5
6
结果:

add_scalars
add_scalars(main_tag, tag_scalar_dict, global_step=None, walltime=None)
1
添加多组数据到tensorboard中
参数:
- main_tag(str):该组数据描述
- tag_scalar_dict(dict):存储标签和相应值的键值对
- global_step(int):要记录的全局步长值(可以看做是横坐标)
- walltime(float):可选的以秒记录事件时间的参数
示例:
from torch.utils.tensorboard import SummaryWriter
writer = SummaryWriter()
r = 5
for i in range(100):
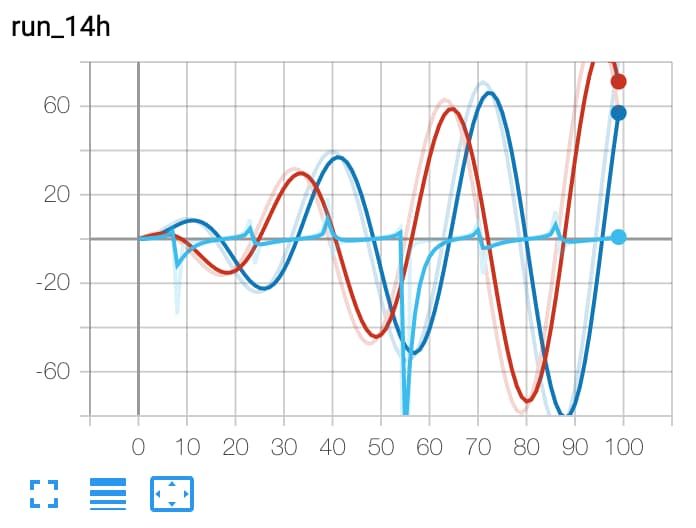
    writer.add_scalars('run_14h', {'xsinx':i*np.sin(i/r),
                                    'xcosx':i*np.cos(i/r),
                                    'tanx': np.tan(i/r)}, i)
writer.close()
# This call adds three values to the same scalar plot with the tag
# 'run_14h' in TensorBoard's scalar section.
1
2
3
4
5
6
7
8
9
10
2
3
4
5
6
7
8
9
10
结果:

add_histogram
add_histogram(tag, values, global_step=None, bins='tensorflow', walltime=None, max_bins=None)
1
添加直方图到tensorboard中
参数:
- tag(str):该数据描述
- values(torch.Tensor, numpy.ndarray, or string/blobname):数据
- global_step(int):要记录的全局步长值(可以看做是横坐标)
- bins(str):{‘tensorflow’,’auto’, ‘fd’, …}中的一个. 决定如何生成bins. 能够从这里找到其他选项: https://docs.scipy.org/doc/numpy/reference/generated/numpy.histogram.html
- walltime(float):可选的以秒记录事件时间的参数
示例:
from torch.utils.tensorboard import SummaryWriter
import numpy as np
writer = SummaryWriter()
for i in range(10):
    x = np.random.random(1000)
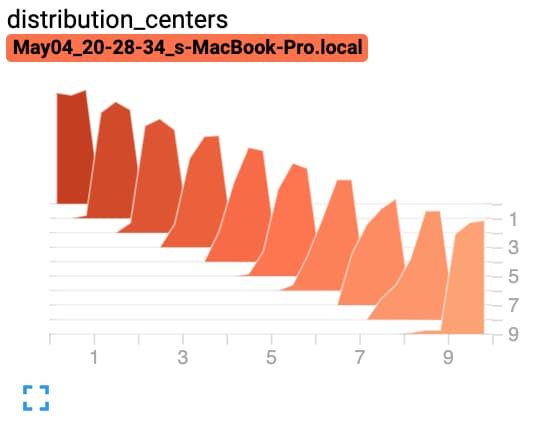
    writer.add_histogram('distribution centers', x + i, i)
writer.close()
1
2
3
4
5
6
7
2
3
4
5
6
7
结果:

其他函数:参考https://pytorch.org/docs/stable/tensorboard.html (opens new window)
编辑 (opens new window)
上次更新: 2024/05/30, 07:49:34
